SEAMIQ · PredictIQ

When will it fail? Answered with a band, not a guess.

PredictIQ runs remaining-useful-life models against live fleet data and gives every component a p10, p50 and p90 end-of-life date, a place in the fleet urgency ranking, and the operating evidence behind the number. The models and the methodology stay yours.

Your models, your IPAny OEMMonte Carlo bandsPrediction vs outcome
PredictIQ · Prediction detail
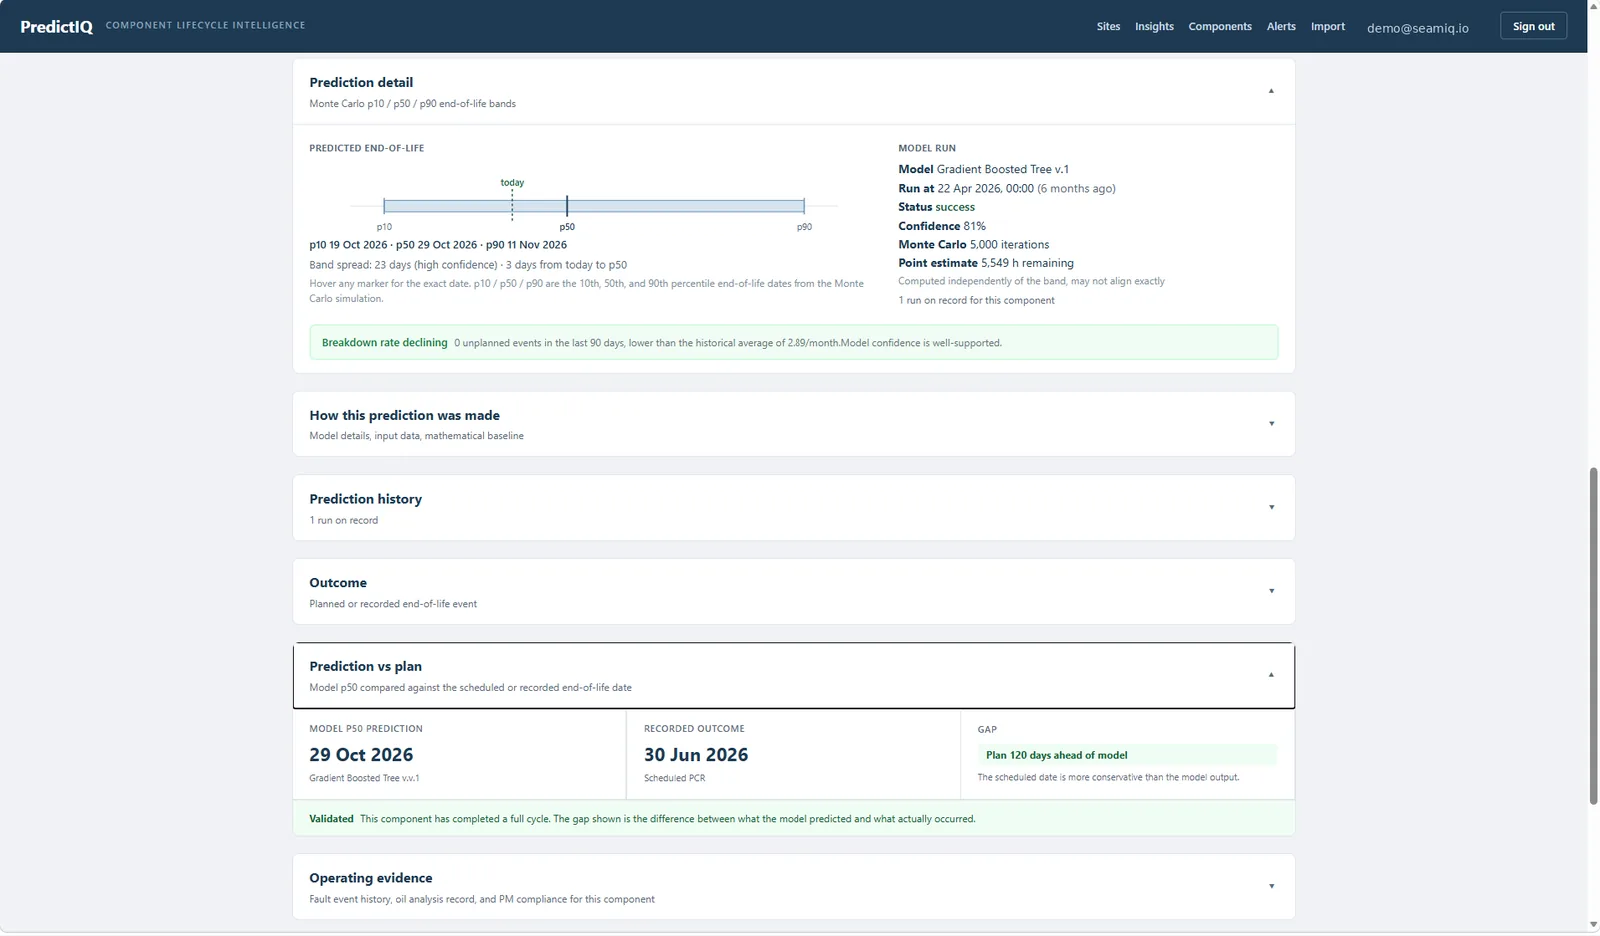
PredictIQ prediction detail with p10, p50 and p90 end-of-life band and model run details
Where the cost hides

A wrong date costs money in both directions

Every component replacement is a bet on a date. Too late and the failure picks the time and place. Too early and the hours left in the component are thrown away. Neither shows up as a line called 'wrong date'.

01
Run past the band
A component past its credible life is a breakdown waiting for a time. When it comes, it is on a haul road, on night shift, with a crew that was planned elsewhere.
02
Changed out too early
A component pulled on the brochure interval with hours still in it. Across a fleet and a year, that is a rebuild programme you did not need to fund.
03
Secondary damage
A failure that was predictable damages the parts around it. The rebuild cost doubles and the downtime with it.
04
The rebuild shop in waves
Nothing for a month, then six at once. Rebuild capacity, exchange stock and the budget all take the shock, because nobody saw the cluster coming.
05
Long-lead parts bought on a guess
Major components ordered to the OEM interval rather than the fleet's own curve. Either the part is on a shelf for a year or it is not there when it is needed.
06
The prediction nobody can check
The reliability engineer's model and the fitter's instinct never meet on a record. When the component fails, there is no way to say whether the method was right.
PredictIQ gives every component an end-of-life band instead of a date, ranks the fleet by urgency and keeps the evidence behind each number, so the decision to pull or run is made on what the fleet has actually done, and can be checked against what happened next.
What it covers

From raw operating data to a defensible replacement date

Two tracks, one screen
Deterministic centreline estimate beside the probabilistic model output. When they agree, you know. When they do not, you know that too.
p10 / p50 / p90 bands
Monte Carlo end-of-life dates with band spread and confidence. Hover any marker for the date.
Fleet urgency ranking
Every component ranked by p10. The planner opens one screen and knows what to act on first.
PCR schedule
Fleet component replacement plan by centreline date, with the model p50 beside it and the 180-day cluster window highlighted.
Operating evidence
Fault events, derate codes, oil analysis flags and downtime for the component, on the same page as its prediction.
Prediction vs outcome
Recorded end of life held against the model p50. The gap is shown. The accuracy record builds with every cycle.
Alert feed
Critical, warning and info alerts on predicted RUL, oil flags and fault patterns. Acknowledge, resolve, dismiss, with a note.
Model submission and audit
Push model runs by API or CSV. Every run logged with inputs, version and outputs. Replay any prediction.
Why mining is different

Component life is a distribution, and the fleet knows it

The brochure life is a target
The OEM target for a component is arithmetic on a design assumption. Application severity, operator behaviour and site conditions move the real number by thousands of hours either way.
The knowledge is in a spreadsheet
Experienced reliability teams already have a predictive method. It lives on one laptop, runs when someone has time, and cannot be checked against what actually happened.
A date without a band is a liability
Planning a rebuild on a single predicted date means betting production on the median. The maintenance planner needs the earliest credible date and the latest.
Thirty components, one crew
Knowing a differential is near end of life is half the job. Knowing it is the third most urgent of thirty across eight trucks is the half that moves the plan.
How it works

Ingest. Predict. Rank. Prove.

PredictIQ is the execution layer for a predictive method. It does not replace the people who built it; it makes their work run every day, across the whole fleet, with a record.

01
Ingest the evidence
Component serials, machine hours, telematics fault codes, oil analysis, maintenance events and recorded outcomes arrive through structured ingestion routes or the API. Historical loads run with evaluation off so you do not inherit a year of stale alerts.
See the evidence
02
Run the model
Your model, or the platform baseline, runs against the current data state and writes a p10, p50 and p90 end-of-life date with confidence and iteration count. Every run is logged and replayable.
See the band
03
Rank and prove
The fleet urgency table and PCR schedule put every component in order. When a component completes its cycle, the outcome is recorded against the prediction and the gap is shown.
See the schedule
Prediction

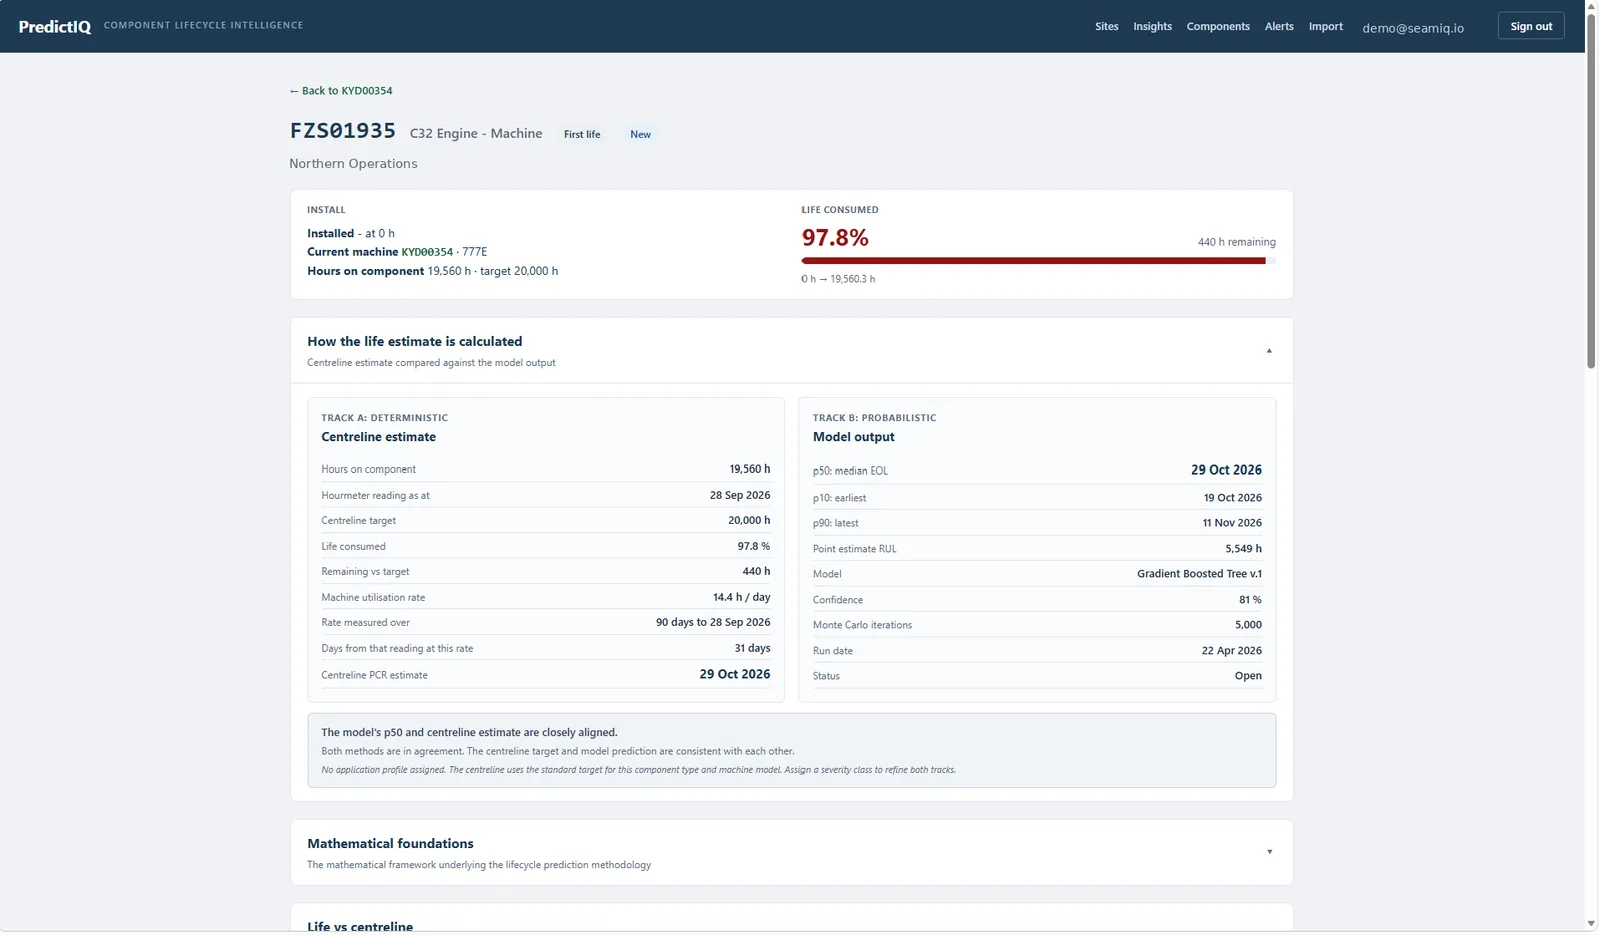
Two tracks to the same answer

Track A is deterministic: hours on the component, utilisation over the last 90 days, the centreline target, and the date that arithmetic gives you. Track B is the model: p50 median end of life, p10 earliest, p90 latest, point-estimate RUL, model version, confidence and Monte Carlo iterations. When the two agree the page says so. When they diverge, the planner sees exactly how far and can ask why.

  • Centreline estimate and model output side by side
  • Life consumed, hours remaining and days to end of life
  • Application severity class refines both tracks
  • Mathematical foundations panel: EFLH, Miner's rule, Archard's equation, visible
PredictIQ · Component lifecycle
PredictIQ component page showing deterministic centreline estimate beside probabilistic model output
Confidence

The band is the point

A single end-of-life date hides how sure anyone is. PredictIQ draws the band: the p10 marker, the p50 marker, the p90 marker and today, with the spread in days and a plain-English confidence read. A 23-day band on a 20,000-hour engine is high confidence. A 200-day band is a prompt to get more data. Both are useful. Only one of them is honest if you show it as a date.

  • Monte Carlo p10 / p50 / p90 end-of-life dates
  • Band spread and confidence stated in days
  • Breakdown rate trend against the historical average
  • Model run metadata: version, run date, iterations, status
PredictIQ · Prediction detail
PredictIQ prediction detail with p10 p50 p90 band, model run details and breakdown rate trend
Evidence

The number and the reasons for it, together

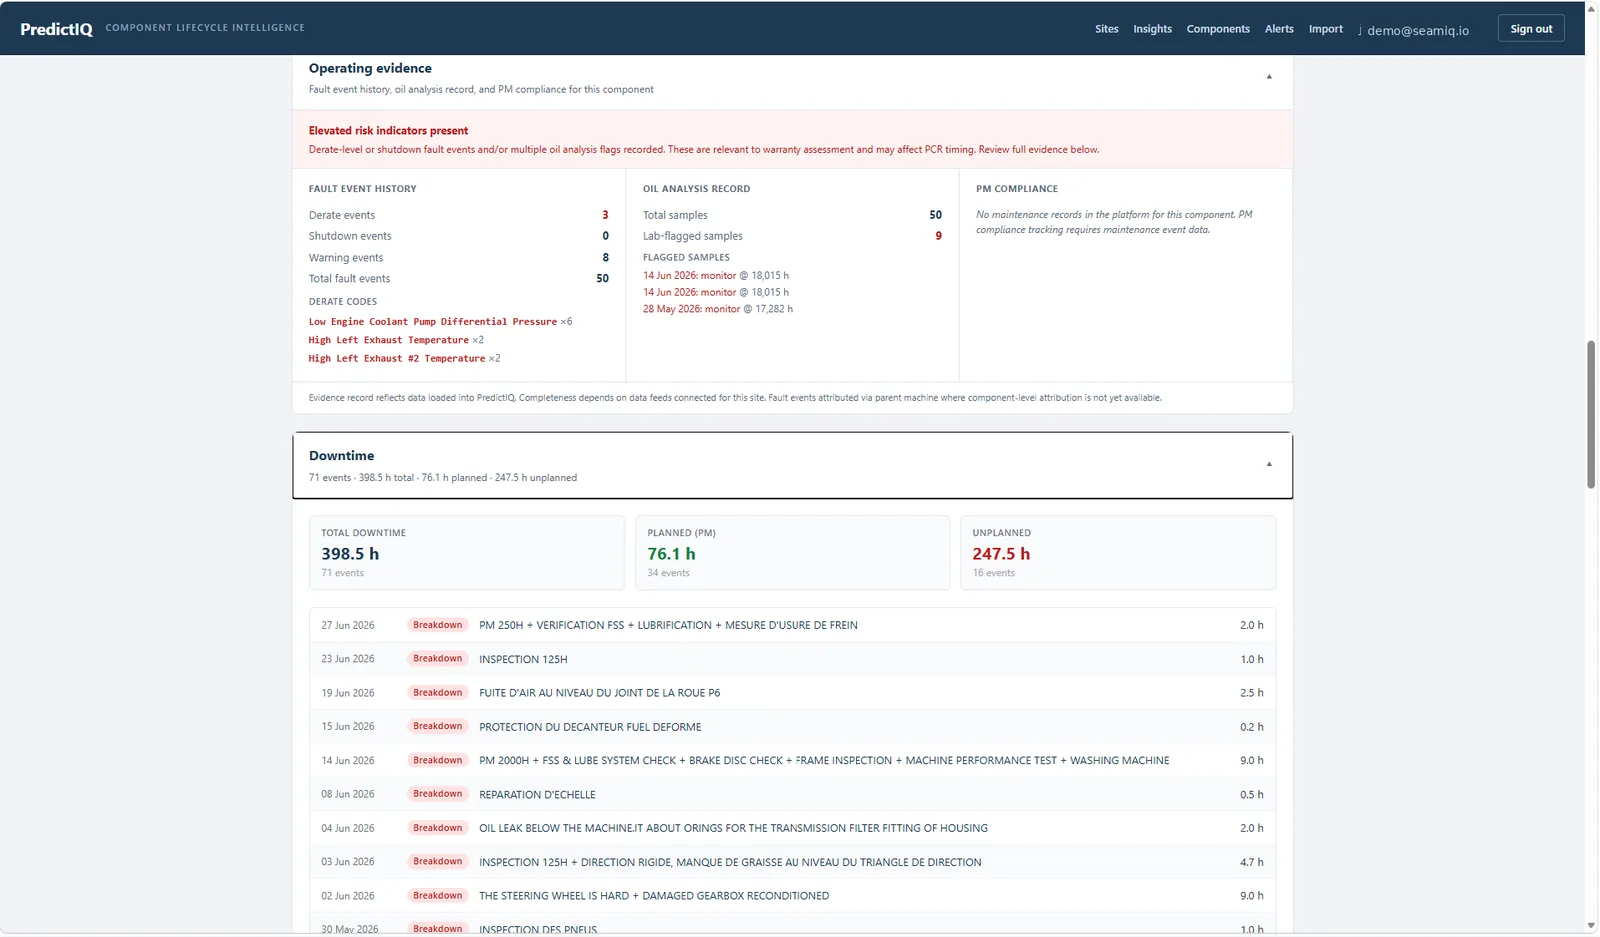
Every prediction sits above the operating evidence for the same component: derate, shutdown and warning fault events with their codes and counts; oil analysis samples with lab flags; PM compliance; and the downtime record split planned and unplanned. Elevated risk indicators are called out. The planner, the reliability engineer and the warranty assessor read the same page.

  • Fault event history with derate codes and occurrence counts
  • Oil analysis record with flagged samples and hours
  • Downtime: total, planned and unplanned, event by event
  • Lifecycle timeline: every model run, sample, fault and outcome in order
PredictIQ · Operating evidence
PredictIQ operating evidence panel with fault events, oil analysis flags and downtime for a component
Schedule

The fleet's replacement plan on one timeline

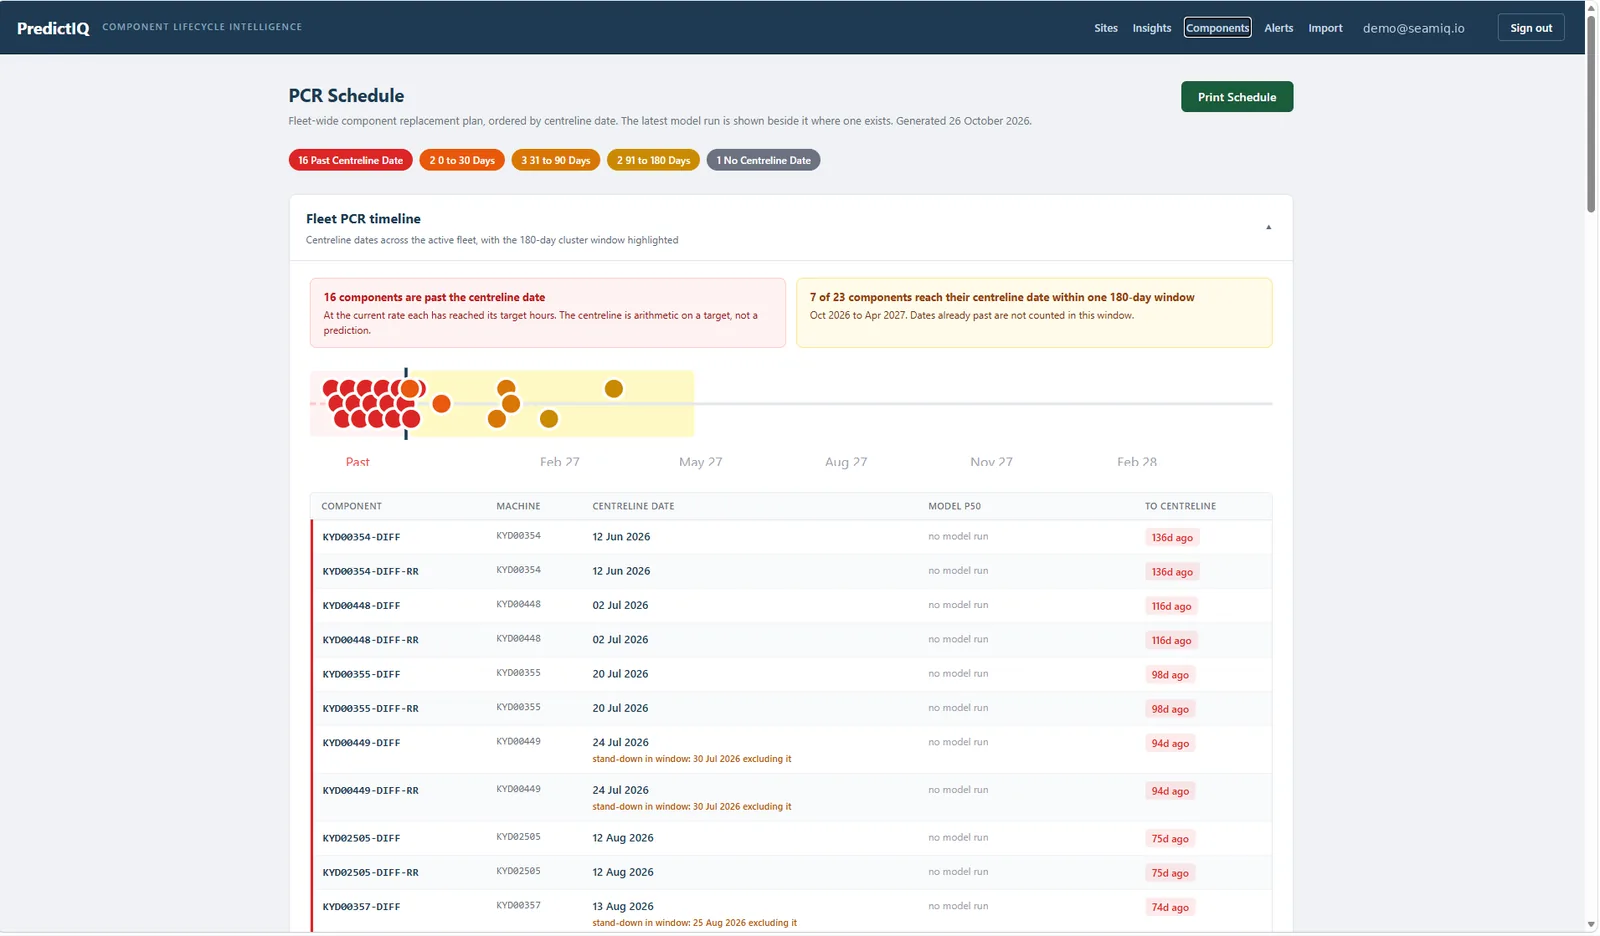
The PCR schedule lists every component by centreline date with the model p50 beside it where a run exists, and the days to centreline colour-coded. Above it, the fleet timeline shows the 180-day cluster window: how many components reach their date in the same half-year, which is the question that decides whether the workshop copes. Stand-downs in the window are flagged against the component they exclude.

  • Past centreline, 0 to 30, 31 to 90, 91 to 180 days, no date
  • 180-day cluster window highlighted on the fleet timeline
  • Centreline date and model p50 side by side per component
  • Print the schedule for the planning meeting
PredictIQ · PCR schedule
PredictIQ PCR schedule with fleet timeline and component replacement dates ranked by urgency
Alerts

An alert feed that knows which component and which site

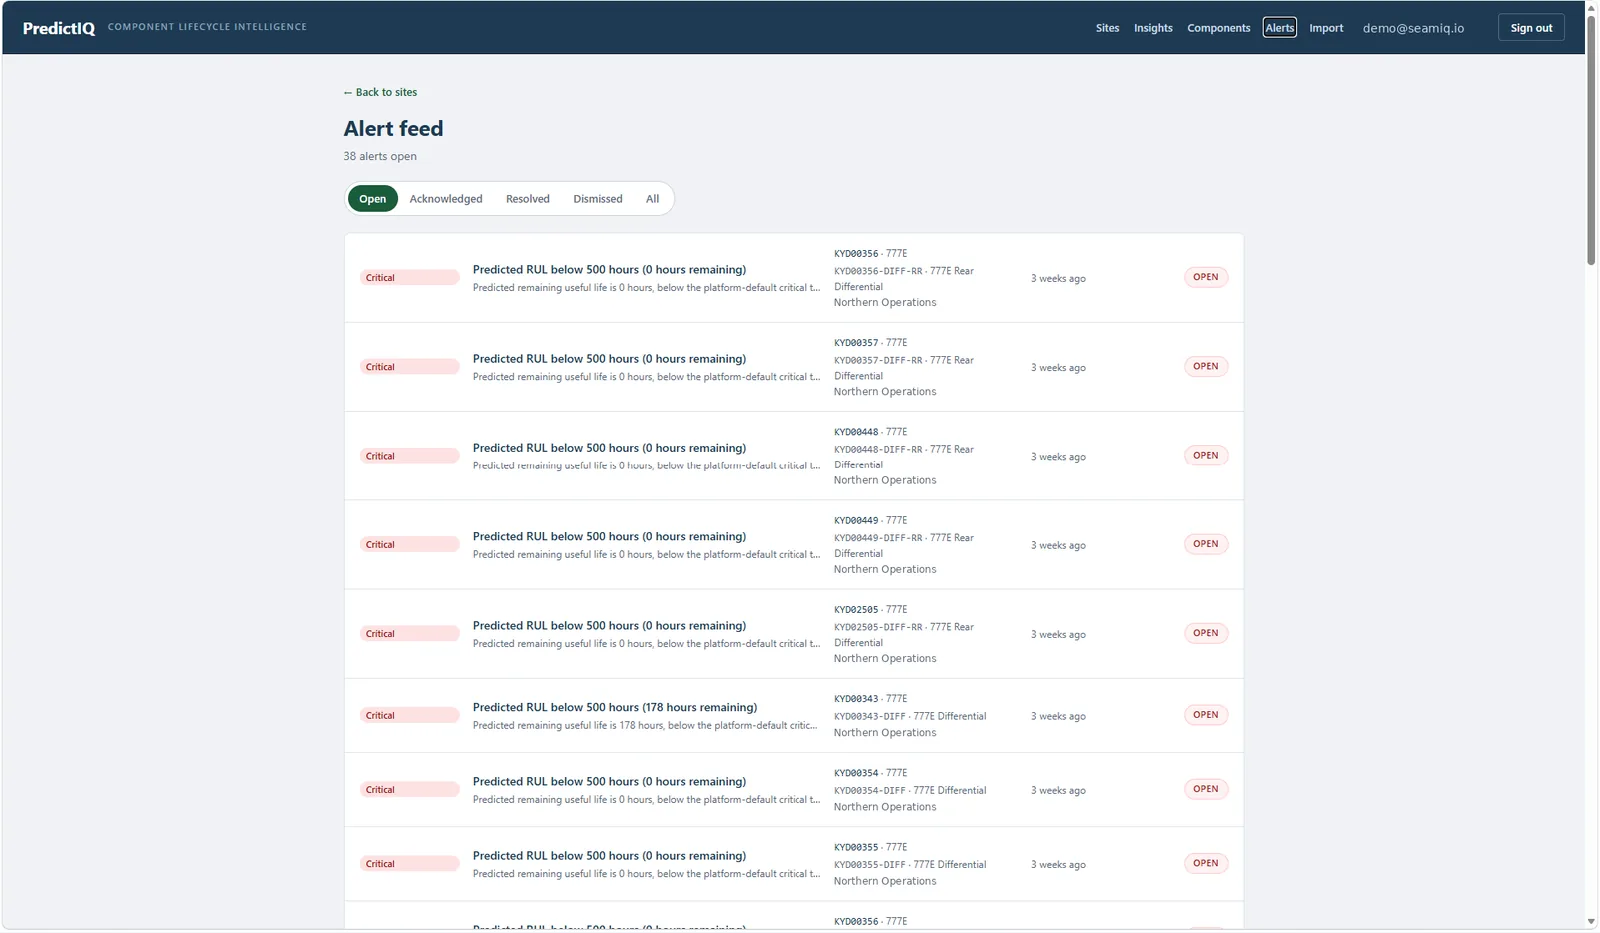
Predicted RUL below threshold, oil analysis flags, fault patterns and overdue centreline dates raise alerts with severity, the machine, the component and the site attached. Acknowledge, resolve or dismiss with a note. The feed is empty until the data says otherwise, and it is wired to fire the moment it does.

  • Critical, warning and info severities
  • Open, acknowledged, resolved and dismissed states
  • Machine, component and site on every row
  • Platform defaults you can override per tenant
PredictIQ · Alert feed
PredictIQ alert feed listing critical predicted RUL alerts by machine, component and site
Also in the box

Everything around the prediction

Fleet urgency ranking
Every active component ranked by p10 on the Insights page. Orphan components flagged rather than hidden.
Printable hotsheet
A two-page fleet summary for the monthly site meeting: PCR review, life versus centreline, oil adherence, urgency table.
Prediction history
Every model run on a component in order, with the delta in days between runs. Drift is visible.
Application severity
Low, average and high severity target life per model and component type, assigned per machine, refining both tracks.
Model submission API
Your data science pipeline posts runs directly, or uploads a CSV through the Import screen. Same validation either way.
Wear element trends
Oil analysis wear metals plotted over hours per component, against the limits that matter.
Machine and site views
Sites to machines to components. Observed versus contracted application profile with an alignment indicator.
OEM-neutral by rule
No manufacturer names or portal vocabulary in the product. Fault code schemes are data, not branding.
Buyer's checklist

How to judge a component prediction platform

Whatever you evaluate, PredictIQ included, ask to see each of these on a screen with one of your own components.

Does the prediction come with a band or a date?
A single end-of-life date is false precision. Ask for p10, p50 and p90 and ask how wide the band is on a component with little data.
Who owns the model?
If the methodology lives inside the vendor's platform, it leaves when the contract does. Ask whether you can take your model files with you.
Can you see what the prediction was made from?
Hours, utilisation, centreline target, model version, confidence, Monte Carlo iterations, run date. If any of that is hidden, the number cannot be defended.
Does it compare prediction to outcome?
Ask to see one component that has completed its cycle, with the predicted date, the recorded date and the gap. If the system cannot show that, its accuracy is unknown.
Is the fleet ranked, or just listed?
Thirty components across eight machines need a priority order. Ask which one the planner should act on first and why.
Does the evidence sit next to the number?
Fault codes, derates, oil analysis flags and downtime for the same component on the same screen as its prediction. A prediction without evidence is a guess with a decimal point.
Does it work across OEMs?
Fault code schemes and telematics formats differ. Ask to see a mixed fleet on one urgency table with no manufacturer missing.
Can the output go into a site meeting as printed paper?
If the mine manager cannot hold it, it will not change the maintenance plan.
Questions people ask

Questions people ask about PredictIQ

Whose models does PredictIQ run?
Yours. If your reliability team or data scientists have built a remaining-useful-life model, PredictIQ is the platform that runs it against live data, every day, across the whole fleet. The model files, the feature engineering and the methodology stay your intellectual property. If you have no model yet, the platform's centreline track and the built-in gradient-boosted baseline give you a defensible starting point from day one.
What are p10, p50 and p90?
Three dates from a Monte Carlo simulation of a component's end of life. p10 is the earliest date 10% of simulations reach end of life, p50 the median, p90 the latest. Together they are a confidence band. A narrow band is a confident prediction. A wide band is an honest one. Planning against a single date hides which of the two you have.
What data does it need?
Component serials and install hours, machine hours, and as much operating evidence as you have: telematics fault codes, oil analysis, maintenance events and recorded end-of-life outcomes. Historical loads come in through structured ingestion with evaluation switched off so you do not get a year of stale alerts. Live data follows through the same ingestion routes or the API.
How is it different from the telematics portal we already have?
The OEM portal tells you what the machine is doing now. PredictIQ tells you when the component will reach end of life, with a confidence band, ranks every component in the fleet by urgency, records what the model predicted against what actually happened, and does it across any manufacturer's equipment. It consumes the portal's data; it does not replace it.
Is the prediction validated?
Every model run is logged with its inputs, version and outputs. When a component completes its cycle, the recorded outcome is held against the prediction and the gap is shown. That accuracy record builds with every cycle and is yours to show a customer, an auditor or a warranty assessor.
Does it work for a dealer's customers as well as for a mine?
Yes. Dealers run it across the sites they support under maintenance and repair contracts and own the resulting methodology. Mines and contractors run it on their own fleet. Either way the data is tenant-isolated and the IP sits with whoever built the model.
What does a printable hotsheet contain?
A one or two page fleet summary for the monthly site meeting: the PCR scheduling review with gaps, life versus centreline for every component, the PCR outlook, oil analysis adherence and the fleet urgency table with p10, p50 and p90. Print it, hand it to the mine manager, done.
PredictIQ
Let's talk

Bring us one component

Pick a component type you lose sleep over. Send the install hours, the machine hours and whatever evidence you hold. We put it through PredictIQ and show you the band, the ranking and the evidence page with your data, not a demo set.

Or email us directly: info@seamiq.io

No mailing lists. We reply personally within one working day.
The platform

Explore the other products